Metro has posted the 1st Qtr 2023 SHS county reports and I have started a FY 2023 compilation of those reports in a single file HERE. (My FY 2022 compilation of all quarterly reports and also ANNUAL reports is HERE).
For this post I am focusing on the FINANCIAL portion of the submitted reports.
Need for Open Data
Comparing those reports is difficult because they are posted in PDF format and not Excel or CSV formats.
I was able to convert those reports with a major effort but moving forward the Oversight and Tri County Metro groups should insist that quarterly report data, including (but not limited to) financial reports, be posted as open data in CSV /Excel formats on the Metro website.
The first table I created shows that in both Clackamas and Washington counties the ending SHS balance was HIGHER than the beginning balance and that the total ending balance in the three counties grew by $12 million from $150 million to $162 million.
The second table shows that while the Multnomah County SHS formula allocation is 45.33% of the Metro total, its share of the FY 2023 budgets for these three counties is higher at 57.69%.
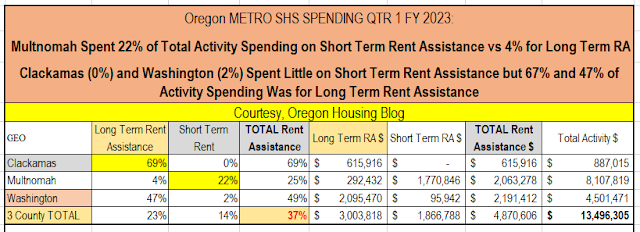
The final table I created shows spending for short range and long range rental assistance as a share of "activity" spending. (Activity spending includes Shelter, Outreach and Safety on/off the Street, Short‐term Housing Assistance, Permanent supportive housing services, Long‐term Rent Assistance, Other supportive services, and Systems and Capacity Building)
This table shows that that 37% of Activity Spending was for Short OR Long Term Rental Assistance, with 23% for Long Term RA. It shows that Multnomah Spent 22% of Total Activity Spending on Short Term Rent Assistance vs 4% for Long Term RA. It also shows that Clackamas (0%) and Washington (2%) Spent Little on Short Term Rent Assistance but 67% and 47% of Activity Spending Was for Long Term Rent Assistance.
Courtesy, Oregon Housing Blog.


No comments:
Post a Comment