In a recent post I pointed out that more than a year had passed since OHCS announced the selection of a master servicer for what is supposed to be the replacement program for the long running SF bond program.
The OHCS bond program is targeted at first time homebuyers with restricted income limits adopted by OHCS and includes a feature that allows cash back for closing costs. The current published rate is 4.875% without cash assistance and 5.75% with cash assistance. [ The legislature provided $10 M for this biennium to make down payment assistance (DPA) available to buyers who use OHCS loans--more on that later].
OHCS and the Private Activity Bond Committee earlier this year decided not to use any of Oregon bond cap for the single family bond program, opting for rental housing use only. OHCS can continue to use recycled bond cap for new loans but that is a limited resource and at some point their capacity to make new loans will effectively end.
I recently rediscovered a 2017 post I authored that provided a history of Oregon SF bond loan volume from FY 1998 to 2016. I decided to update that through FY 2021 and will update again after the current FY ends. (All SF loan volume data comes from OHCS financial audits).
2nd Half of 24 Year Cycle Produced Only 28% of Loans
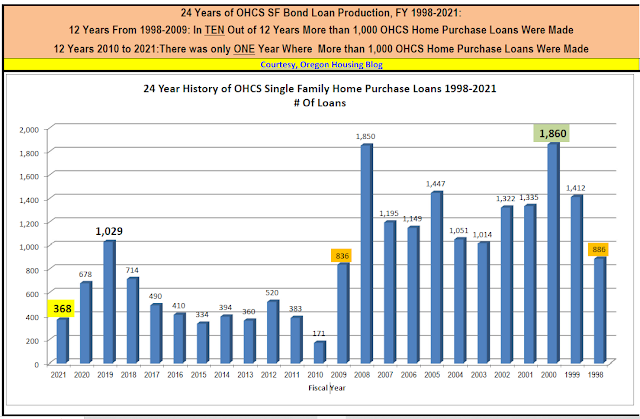
- The 24 year history shows that for the first half of the 24 year cycle (1998-2009) there were TEN of the 12 years where loan volume was 1000+ loans. In the second half of the cycle (2010-2021), there was only ONE year with loan volume of 1000+.
- The first 12 years of the cycle accounted for 72% (15,357 loans) of the total 21,208 loans made in 24 years.
- The 5,851 loans made in the second 12 years of the cycle were only 28% of the total loans made in 24 years.
While Population Grew, Loan Volume Shrank
- During this 24 year period population in Oregon grew by 27%, but SF loan volume in FY 2021 was 58% below loan volume in 1998.
- IF the ratio of loans to population in 2021 was the same as 1998, the Oregon SF bond program would have originated 1,102 loans, not 368 loans, an increase of 200%/735 loans.
New Excel and PDF File
I have posted a link to a new Excel file HERE and the first worksheet has two graphs, a summary table showing loan and population comparison, and then the FY data for all years. The second worksheet has links to all of the source data I used.
The 3 page PDF HERE also has those graphs and data.
The graph from the 1st page is pasted below and shows the declining volume of OHCS SF bond loans for these 24 years.
Originally created and posted on the Oregon Housing Blog.


No comments:
Post a Comment