Showing posts with label unemployment. Show all posts

Tuesday, July 21, 2020

Oregon Workshare: 60% of Workshare UI Claims Were From Public Employees.

I’m pleased to report that the Oregon Employment Department has responded to my public record request with a snapshot of private and public employees who are participating in Workshare.
 

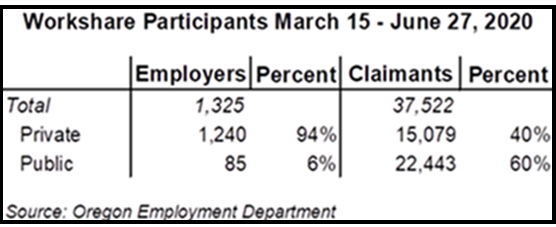
March 15-June 27
From March 15-June 27 the OED breakout shows that 60% (22,443 ) of the total 37,522 Workshare claims were public employee claims. The average number of claimants per public agency was 264, while the average number of claimants per private employer was much lower at 12. 
My Updated Projections Through July 11
DOL records show that Oregon Workshare continuing claims have increased from 28,498 from the week ending June 27 to 51,173 as of July 11.  

So, if the OED reported 60% public employee percentage distribution as of June 27 held, the data in the latest DOL report would mean that the total number of public agency employee Workshare continuing claims is now 30,704. Given the recent large spike in claims if the public agency share during the spike was greater than 60%, than the total public agency percentage and counts would be higher than 60% and 30,704.

Because the total number of Oregon state and local employees is close to 250,000, a total of 30,000 public agency Workshare continuing claims would represent about 12% of total Oregon state and local government employment, which is close to the overall Oregon insured unemployment rate. 

NOTE:
If the $600 UI supplement expires on July 25 as scheduled, or if it is not renewed at some level, there could be a rapid and significant drop off in all continuing claims, including Workshare claims at public agencies. 

Conversely, as I pointed out in my recent post, IF the UI supplement and supplement expiration date are extended and IF the Workshare Dec 31st expiration date is also extended, this could provide an important tool to help Oregon state and local governments reduce their wage expenses in a challenging budget environment (as Workshare is 100% federally funded).


Originally created and posted on the Oregon Housing Blog.

Thursday, July 7, 2011

More Mortgage Relief/Forbearance for Unemployed with FHA Loans.

HUD PR is HERE.  

Fact sheet HERE says changes will be effective for two years, starting August 1, 2011; sheet also references upcoming change in non FHA Treasury led Home Affordable Unemployment Program (UP) Forbearance Program.

FHA Mortgaee Letter 2011-23 has more detail HERE

Originally created and posted on the Oregon Housing Blog.

Tuesday, February 15, 2011

Hardest Hit Mortgage Payment Assistance Background, Including My Analysis of Eligible Submissions by County.

OHCS staff were kind enough to provide to me with materials used for a Hardest Hit update at a House Ways and Means Subcommittee meeting last week. 

I have put all the documents into a ZIP file that you can download HERE. (Documents include maps, background materials, a process flow, and a PowerPoint presentation).

I also completed a new analysis of one of the OHCS documents that shows the number of slots by county and the number of eligible submissions received by OHSI. I added some data showing the number of unemployed by county in September 2010 ; my analysis is found in the 2 page PDF HERE

Some observations
  1. Because overall cost per household is less than original projections OHSI is now projecting that they will be able to help 5,787 households with the Mortgage Payment Assistance Program, 16% more than the 5,000 they originally projected. (Instead of initial cost projection of $20,000 per family appears that average cost per family is now projected at $17,280 [$100M/5,787 households]).
  2. It appears there were 23 counties that were under subscribed [fewer eligible submissions than allocated slots] and 13 that were oversubscribed.
  3. The two counties with the highest oversubscribed %'s [MORE eligible submissions than allocated slots] were Multnomah and Lane; the most under subscribed counties were Sherman and Grant.
  4. The 5 Portland metro counties had 960 slots assigned to them, and 2,275 total eligible submissions, an over subscription count of 1,315 and a over subscription rate of 137%. 
  5. HOWEVER, while these 5 Portland metro counties generated 39.3% of all MPA eligible submissions, they also had an even HIGHER % (47.8%) share of the total state unemployed in September 2010.
  6. [ I recognize that applicants did NOT have to be unemployed to be eligible for the MPA program].

Feel free to add YOUR observations as comments to this post.

Originally created and posted on the Oregon Housing Blog

Thursday, February 10, 2011

Hardest Hit Update with Audio: Mortgage Payment Program Will Help ALL Eligible Applicants--6,000.

Today the Oregon Ways and Means Subcommittee On Transportation and Economic Development heard an information update on the Hardest Hit program. 

I recorded the hearing, and posted a MP3 audio file to the Internet Archive, HERE

From my notes, the highlights: 
  • There were  a total of 15,700 total applicants, but only about 6,000 were eligible.
  • Because per family costs were less than the projected $20,000, Mortgage Payment Assistance Program will be able to help 6,000 applicants--ALL applicants found to be eligible. (Original projection was 5,000 households). 
  • Notifications to eligible applicants selected for program will go out today.  There is still loan underwriting and some additional steps before loan proceeds will be available; likely some payments on behalf of borrowers will start in March. 
  • 24 counties were under subscribed, but if funding is still available, slots not used these counties will be opened once again in the future via a simultaneous relaunch of the program in all those counties. (Only specific under subscribed counties I am aware of are Crook and Klamath). Request was made by one Senator to keep Mortgage Payments funds in the counties where slots were not used, even if used for different HH program.
  • Small business owners were eligible for program, used YTD profit and loss statements to make determination of income loss.  
Other issues: 
  • Third version of Underwater program [Deschutes/Jackson counties] currently at US Treasury. Hope to hear during next couple of weeks, could be a national model.
  • Hope to move other programs in March or April. 
  • I have asked for the PowerPoint and other documents made available to the Committee, including the list of slots and applications by county.
Originally created and posted on the Oregon Housing Blog.

Sunday, January 23, 2011

Oregon Hardest Hit Mtg. Payment Program: Can Make 12 Monthly Payments on $1.25 Billion of Mortgage Debt AND $10 Million in Property Tax/Insurance Payments.

I thought it might be useful to put in perspective how much mortgage debt that the $100 million in Oregon Mortgage Payment Assistance will support over the next 12 months.  The results I calculated are shown in the table HERE.

Results/Methodology:
Per Family Calculation
Using the $20,000 per family limit and a set aside of 10% of the funding per family to pay for property taxes and insurance would leave $18,000 annually /$1,500  per month available to pay debt service. Using a 6% assumed interest rate this level of funding can make 12 full debt service payments on a mortgage of $250,187 AND also cover $2,000 in property tax and insurance payments.

Total Program Calculation
Multiplying the $250,187 per family mortgage/debt service support for the 5,000 expected families results in the calculation that the program would be able to make 12 months of full debt service payments on mortgages that total $1,250,937,108.

Program funds would also be sufficient to ALSO make $10 million in property tax and insurance payments. 

(Changing the assumed interest rate or the assumed % reserved for property tax or insurance would change the total mortgage debt serviced amount; changing the $20,000 amount per family would NOT, but it would change the number of families served.).  

Final note: For more perspective, the $1.25+ billion in mortgage debt supported by the Oregon Hardest Hit Mortgage Payment Assistance Program is 76% of the $1.65+ billion FHA refinance loan volume in Oregon during all of CY 2010.

Tuesday, January 18, 2011

Oregon Hardest Hit: Preliminary Word-14,000 Completed Applications.

In response to a question, OHCS staff has advised that by the Jan 14th deadline the Hardest Hit Mortgage Payment Assistance program received 14,000 completed applications.   

While staff did not directly indicate this, I would expect that some % of the completed applications will drop out, so the final number of accepted, eligible applicants would I guess be lower than 14,000. 

No word yet on applications by county vs slots; I would hope that information will be forthcoming this week, prior to the State Housing Council meeting on Friday. 

[Last time I saw Victor Merced I had predicted 15,000 applications, so this application level is "close enough for government work"]):

Originally created and posted on the Oregon Housing Blog

Tuesday, December 28, 2010

OHCS: Halfway into Application Cycle 4,300 Mortgage Payment Assistance Applications Completed, Another 3,400 in Process.

At about the halfway point in the application cycle, OHCS staff have advised me that 4,300 unemployed or under employed home owners have completed the online application for the Oregon Mortgage Payment Assistance Program, with another 3,400 applicants in some stage of completion. 

This $100 million program has a minimum of 5,000 slots available, with recipients to be chosen by individual county lotteries from amongst all applications received by January 14, 2011. (My prior table HERE had estimated chances of wining by area, using only counts of unemployed; ACTUAL chances of winning will be determined by number of accepted applications in each county vs. number of slots in that county).

The OHSI website, which includes an on line eligibility test for this program, is HERE

Originally created and posted on the Oregon Housing Blog.

Tuesday, October 12, 2010

Chase Agrees to Participate in Michigan Hardest Hit Program to Make Mortgage Payments for Unemployed.

News story is HERE.

PMorgan Chase & Co. said Monday it will help unemployed Michigan borrowers by participating in a fund set up by the state to pay a portion of the residents' mortgage payments for up to a year.

Michigan's Hardest Hit fund helps qualified borrowers by paying up to half of their mortgage payments for up to 12 months, saving them thousands of dollars.

The help will be available for Chase customers who are behind on their mortgage payments as well as those who are current. Chase said it will roll out the program once the Michigan State Housing Development Authority has all the logistics in place.

When a homeowner calls Chase, a counselor will ask basic eligibility questions and then send an application package to the homeowner by overnight delivery. If the application is approved, payment help will begin.
Hardest Hit funded states, including Oregon, had previously had difficulty in enlisting lenders for this kind of program, perhaps this represents the breaking of that logjam?

Originally created and posted on the Oregon Housing Blog.

Tuesday, October 5, 2010

HUD Rolling Out $1 Billion Emergency Homeowners Loan Program; Hardest Hit States Not Included, but That's a Good Thing.

HUD PR is HERE (MS Word). Program is modeled after 35 year old Pennsylvania HEMAP program.

Per Homeowner with a Mortgage: Hardest Hit States, $283; Emergency Assistance States $41.
Hardest Hit states should not feel left out. I prepared a new table HERE ranking states by the amount allocated per homeowner with a mortgage for both Hardest Hit and Emergency Assistance programs . It shows:
  • Oregon ranks 6th highest in the country @$336.
  • The Hardest Hit state average is $283 compared to only $41 for Emergency Assistance states. 
  • The highest Emergency Assistance state (Mass) at $53 per homeowner with a mortgage was less than 1/3rd of the lowest Hardest Hit state (Indiana) at $181.
Originally created and posted on the Oregon Housing Blog.

Monday, July 5, 2010

CORRECTED: New Excel Data Tool for Annual and Monthly Oregon Metro and Statewide Employment/ Unemployment Data, Jan. 2000-May 2010.

MANY thanks to a OHB subscriber who pointed out errors in the formulas in this Excel workbook. 

I have gone in and made changes in the Excel lookup formulas that I believe correct the problem. I have removed the old Excel file and changed the link below to link to a NEW version of this workbook, dated July 8th. My apologies to all.

Should you encounter a problem with the revised file, please DO let me know. 


----------------
I have created a new Excel data tool HERE that allows the comparison of Oregon statewide AND metro area labor force, employment, and unemployment numbers, as well as unemployment rates. 

Data for any area chosen by the user can be compared on a monthly or an annual basis; the most recent month available is May 2010, and the oldest data is for January 2000. 

The first worksheet is a Pivot Table that provides two methods of comparison. The first is a quick comparison for two different time periods and includes an automatic calculation of the difference in the two time periods. The second method allows the user to select and compare up to 11 geographic and time periods. While there is no automatic combination of differences in this second method, I left a scratch pad area below to allow users to do their own calculations if they choose to do so. 

The default settings in the Pivot Table show quick differences in the May 2009 and May 2010 data for Bend. Looking at that data you will see that the number of unemployed and the unemployment rate both declined from May 2009 levels, but SO TOO did the number of employed and the size of the labor force.

The second default comparison in the Pivot table is of data for Oregon statewide for May of each year from 2000-2010.You can see that the total employment in Oregon grew by 12,000 from May 2000-May 2010. With a much large growth in the labor force of 149,000 however, the end result was that the unemployment rate increased from 5% to 11.6%.

The second worksheet in the workbook contains the monthly and annual raw data used to calculate the Pivot Table. 

Both worksheets are password protected where appropriate to prevent the inadvertent deletion of data. All data is from (federal) Department of Labor, Bureau of Labor Statistics (Oregon data is retrievable HERE), and is NOT seasonally adjusted. 

PLEASE do let me know if you run into some problems in using the workbook, or questions about the data you see.

Originally created and posted on the Oregon Housing Blog.

Thursday, July 1, 2010

Portland Metro Area Unemployment Rate Higher than Metro National Average, But Improved Faster than Other Metro Areas.

WSJ has story HERE, with data indicating that Portland Metro May 2010 unemployment rate at 10.2% is still higher than national unemployment rate of 9.3%.


I prepared table HERE which took table from WSJ story and added additional comparisons; rankings are from worst (1) to best (49). 

Some Portland Metro observations:

  • Portland metro ranking improved, by dropping from 7th worst to 14th worst from May 2009 to May 2010. 
  • Portland's May 2010 unemployment rate of 10.2% remained above the median unemployment rate of 9% for the 49 largest metro areas. 
  • Portland was only one of 15 metro areas to see improvement from May 2009 to May 2010 with an unemployment rate that was a .6 point decline, compared to a 49 metro area median increase of .5 points. Only 5 other metro areas had a higher point unemployment rate decline than Portland did during this time period. (Minneapolis, Detroit, Charlotte, Buffalo, and Milwaukee).
Originally created and posted on the Oregon Housing Blog.

Saturday, June 5, 2010

Update:Following Grants Pass Lead, Jackson County Commissioners Plan Appeal on Hardest Hit Decison to Include Portland Metro Counties in Hardest Hit Priority Counties.

 Update: I added a bullet showing share of the number of 2009 statewide average unemployed found in 16 counties; turns out that it is slightly LESS than  the share of total unemployment in the 4 added counties (38.5% vs 38.6%)
------------
Medford Mail Tribune has story HERE saying that Jackson County Commissioners plan to consider sending a formal appeal to OHCS at the Commissioners June 9th meeting. The appeal would protest the inclusion of 4 counties (including Clackamas and Multnomah) in the group of 20 counties targeted to receive 80% of Hardest Hit program funds.

Story also relates that Grant Pass Mayor has been leading the effort to not include the four additional counties.(A copy of resolution passed [starts on page 3] by Grants Pass City Council on May 19th is HERE; resolution erroneously asks to limit allocation to 14 counties, which would have excluded Lane and Wallowa counties, who had average rounded unemployment of 12%).

Four Counties Added to Original 16 Counties Had 38.6% of Average Number of Unemployed in Oregon in 2009.
Looking back at unemployment numbers for 2009 (see prior posted Excel spreadsheet HERE):
  • Jackson county had on average 5.9% of the total number of unemployed in the state and Josephine County had 2.3%, for a combined total of 8.2%.
  • Clackamas had 9.5% of the total average unemployed in 2009 and Multnomah 18.7% , for a combined total of 28.2%.
  • Marion and Yamhill, the other 2 counties added to the distressed county listing, had 7.9% and 2.5% of the average unemployed in the state, or a combined 10.4% of Oregon's average number of unemployed for 2009.
  • Combined the four distressed counties added to the original list of 16 counties had 38.6% of Oregon's average number of unemployed in 2009.
  • The original 16 counties with unemployment rates of 12% or higher had 38.5% of the Oregon's average number of unemployed in 2009, slightly less than the 38.6% found in the four added counties.
Originally created and posted on the Oregon Housing Blog.

Sunday, April 4, 2010

Florida Posts First State Draft Allocation Method and Strategies for Hardest Hit Funding.

As I have said previously, Oregon will benefit from the work being done by states selected in the first round of Hardest Hit funding. (Use keyword Hardest Hit to find all posts on this program).

I have done a quick search of websites for the first 5 states funded (Arizona, California, Florida, Michigan, and Nevada) and Florida appears to be the best in posting information up to this point.

Florida's DRAFT targeting formula uses a variety of factors to arrive at how funds will be allocated. All of this I am sure is subject to change, but nonetheless the draft Florida allocation formula HERE is a good idea of the kinds of factors being considered elsewhere.

A second DRAFT Florida strategies document HERE provides more background on the factors being considered in putting together their program.

While allocation method and strategies are important, the delivery model, program design, outreach, and public transparency will be at least as important in putting together a successful $88 million Hardest Hit program for Oregon.

Originally created and posted on the Oregon Housing Blog.

Saturday, April 3, 2010

New Data for Oregon Hardest Hit Program: 2009 Employment, Unemployment, and Unemployment Rates by County/MSA.

In a very short period of time OHCS and the Oregon Housing Council will need to make decisions on how to program and allocate the largest housing grant in Oregon's history--the recently announced $88 million "Hardest Hit" grant (search keyword Hardest Hit for prior blog posts).

The primary stated reason that Oregon received the grant was because of concentrated unemployment. (see Treasury release HERE for official explanation). This likely means that OHCS will be looking closely at prioritizing areas of the state where the occurrence and rate of unemployment has been the highest, I.E.--the Hardest Hit.

Comprehensive 2009 Oregon Unemployment Data Posted in Excel
To stimulate thinking about the allocation decision that OHCS will be making, I have assembled a comprehensive Excel workbook HERE which includes, for each Oregon COUNTY and MSA, counts for each month in 2009, and a 2009 average of:
  • # in Civilian Labor Force.
  • # Employed.
  • # Unemployed.
  • Unemployment Rate, including seasonally adjusted unemployment rates.
All of my data comes from special reports I constructed using the Oregon Labor Market Information System (HERE).

A couple of initial observations:
  1. In the unemployment rate worksheet, I have highlighted columns with an unweighted average unemployment rate of 12% or more--there are 16 counties. Many are rural counties. Metro exceptions include Columbia, Lane, Jackson, and Deschutes counties.
  2. If you look at the unemployed worksheet you will see that the 5 Metro Portland counties had on average 44.6% of all unemployed workers in the state in 2009. This is a slightly lower % than the 48.5% of the total statewide labor force found in these counties. This suggest that these counties DO represent a big share of all unemployed in Oregon but may be somewhat less "hard hit" if unemployment rates are used for comparison. (Yep, I realize this is subject to interpretation and others may view this differently AND also that unemployment counts or rates will NOT be the sole factor in the allocation process).
I expect that OHCS funding allocations will strike some sort of balance between unemployment rates AND the share of all unemployed workers found in different locations around the state AND will include factors other than unemployment (defaults, foreclosures, etc).

Notes: If you uncover any errors in the workbook please let me know--it was a lot of data to crunch in less than 24 hours since Friday's Council meeting.

Originally created and posted on the Oregon Housing Blog.

Wednesday, January 21, 2009

Intel Hillsboro Closing Will Cut 1,000 Jobs.

Oregonian Silicon Forest Blog has story HERE.

On top of yesterdays spike in unemployment, this is latest, but not the last, of bad economic news.