Showing posts with label unemployment insurance. Show all posts

Tuesday, June 22, 2021

PUA State Reported Data on Payments, Overpayments, Fraud Overpayments and Recovered Fraud Overpayments Through 1st QTR. 2021.

I've read a number of news stories that report large sums of unemployment insurance overpayments and fraud. 

Missing in many of these stories are links to ACTUAL replicable data sources. 

While it is clearly possible/likely that there IS a substantial (and unexplained) gap between overpayment and fraud overpayment rates in the last year compared to past years, states DO report quarterly or monthly data on payments, overpayments and fraud overpayments and recoveries. 

Referencing the actual data as reported by states seems like an important starting point for stories about overpayment and fraud. 

The PDF HERE and pasted below provides my analysis of the relevant data for the 100% federally funded PUA program for CY 2020 through the first quarter of CY 2021.  

It includes [at the top left] a link to download a CSV file with data from relevant report (ETA 902P), the identification of the FOUR columns where relevant data can be found, and three calculated columns that show rates of overpayment, established fraud, and collections of established fraud.  (The 902P source report is monthly, unlike several other UI program overpayment and fraud overpayment reports that are quarterly).

As noted at the bottom of the table a handful of states (including Florida) have not filed their 1st quarterly report as of June 21st and the PUA data does NOT include FPUC payments made to PUA recipients. [I checked and the last PUA report filed from Florida was September 2020]. 

Observations on STATE REPORTED PUA data:

  1. PUA payments were $96.8 billion. In Oregon they were $712 million. 
  2. Established PUA overpayments totaled $4.4 billion, In Oregon, they were $1.2 million. The LARGEST PUA overpayment total was $1.3 billion in Illinois. 
  3. Established overpayments averaged $45.90 per $1,000 of PUA payments, In Oregon, they averaged $1.75. 
  4. Established fraudulent overpayments were $494 million. In Oregon they were $196,000. The LARGEST fraudulent overpayment total was in Ohio at $162 million. 
  5. Recovered fraudulent overpayments totaled $4.9 million. In Oregon there were no fraudulent recoveries. New York reported the LARGEST total fraudulent recoveries at $3.8 million.
  6. Recovered fraudulent overpayments recovered averaged 5 cents for ever $1,000 in PUA benefits.  In Oregon there were no fraudulent recoveries. 

There are many more data elements in the 902P report than those I highlighted. Here's a data map of those data elements (page 47 in the complete data map file). 

I encourage researchers and the media to ground research and reporting on the actual data as reported by the states. 

<

Tuesday, June 15, 2021

$3.9 Billion in 3 Pandemic Unemployment Insurance Programs in 2020: Fraud Reported by Oregon Employment Department Was 39 Cents Per $1,000 in Benefits; Recovery Was 1 Cent Per $1,000 in Benefits.

Fraudulent Payments are NOT Unique to Unemployment Insurance or Pandemic Unemployment Insurance Programs

As with many of the pandemic assistance programs the rush to make unemployment insurance payments likely has resulted in significant over payments and fraudulent payments. Unemployment insurance is not unique as it seems highly likely that improper and fraudulent payments have and will occur in the PPP, Restaurant Recovery, and Venue Recovery loan and grant programs, rent relief programs, homeowner relief programs,  recovery act payments, and in child tax credits.

Because pandemic unemployment insurance payments currently substantially exceed regular unemployment insurance payments in Oregon I thought it might be interesting to see how much Oregon has previously reported in fraudulent pandemic unemployment insurance payments and how much of that reported amount has been recovered in CY 2020.

To be clear I am focusing only on 2020 dollars of fraud discovered and recovered for these pandemic unemployment insurance programs: PEUC, FPUC, and PUA. 

I am NOT focusing on all unemployment insurance programs, nor on all improper payments, nor on ID theft which is a subset of overall fraud. 

OED Doesn't Disclose Unemployment Insurance Fraud Data to the Public

The Oregon Employment Department has repeatedly declined to release information about unemployment insurance fraud on the theory that public disclosure could undermine their efforts to prevent unemployment insurance fraud.

But OED Does Report Fraud Data in Quarterly and Monthly Reports to the Department of Labor.

In the absence of information from OED I dug out from DOL websites  calendar year 2020 information for three pandemic unemployment insurance programs: PUA, PEUC, and FPUC. This data is derived from official report data as submitted by OED. 

Planning, locating and extracting data from multiple reports was the challenge and likely the reason there has been little reporting of actual fraud counts and dollars not just in Oregon but around the country. I was able to do so and will be able to track that reporting on an ongoing basis. 

To my knowledge this DOL required data is the only public facing official source of fraud data for unemployment insurance programs. 

IF this reported data is incomplete or inaccurate the fraud data reporting shortcomings for Oregon seem likely to have been repeated in other states and the DOL would therefore have no reliable source of data to monitor fraud in these unemployment insurance programs.

The table pasted below shows these CY 2020 results (and the data sources). 

My Observations

OED Data Reported to DOL:

  • $1.5 Million in fraud was identified out of $3.9 Billion in pandemic UI payments.
  • Of that $1.5 Million in detected pandemic UI fraudulent payments only $53,000 was recovered.
  • IF reported fraud and recovered fraud payments were only 1% of total pandemic benefits the amount of reported and recovered fraud would have been a much higher $39,440,000.  
  • In CY 2019 DOL reports show that the Oregon fraud rate for the regular unemployment insurance program was 4.3%+; at that rate total pandemic fraud would have been more than $172 million in 2020).

This Means That: 

  • Reported fraud was only 39 cents for every $1,000 in pandemic UI payments.
  • Reported recovery of established fraud amounts was only 1 cent for every $1,000 in pandemic UI payments.
  • It seems highly likely that 2020 official fraud reporting for these pandemic programs understates the scope of the problem. 

CAVEATS
  • This data is for CY 2020, it's possible there has been improvement during CY 2021, including stepped up recovery of previously identified fraudulent payments. 
  • This data is ONLY for theses three pandemic programs. Fraud identification and recovery could be substantially different for the Regular Unemployment and Workshare UI programs. 
  • Fraud under the Unemployment insurance Lost Wage Assistance program is not included in this analysis.

Originally created and posted on the
Oregon Housing Blog.


Wednesday, December 2, 2020

Oregon's 2021 Projected Unemployment Insurance Tax Collections Up 34%/$269+ Million to $1.065 Billion.

The Oregon Employment Department issued notices in November to employers with 2021 changes in the unemployment insurance rates that they pay for their employees. 

Individual employers will pay different rates based on prior claims experience, but on average the rate will move from 1.94% of taxable payroll to 2.26% of taxable payroll. The taxable base wage will increase from $42,100 in 2020 to $43,800 in 2021. 

Estimated Unemployment Tax Collections in 2021 Projected to Increase by 34%/$269 Million.

OED has also advised me that their projection is that total taxable payroll will be $47,130,000,000 in 2021, vs a projected $47,609,418,000 in 2020 (2020 data is from ETA report 204). 

Using the average tax rates from above this would mean projected tax collections of $1,065,138,000 in 2021 vs $795,123,000 in 2020. That's a one year increase of 34%/ $269.215 Million. 

2011-2021 Graph of Historical UI Tax Rates and Taxes

To provide some historical context I prepared the graph pasted below that shows for 2011-2021 the average tax rate (calculated on both taxable payroll and total payroll) and the estimated employer contributions, as found in the ETA 204 report (with 2021 data from OED). No inflation adjustments have been made.


2021 Is Only The Start of  Annual Unemployment Tax Increases

The 2021 UI tax increase would have been higher except that many benefits were 100% paid this year by the federal government and calculation of UI taxes for 2021 only uses a portion of the 2020 period when benefits spiked. 

Also, as my prior post HERE noted, the projected unemployment trust fund is projected to decrease by more than $4.3 billion from March 2020 to March 2024. 

This likely means that future years will require additional tax increases, a pattern that occurred after the last great recession in 2010.  

Important: The increase in UI taxes is not a bug, it is a feature of the system

UI tax changes, up or down, keep the UI fund self sufficient and solvent and avoid borrowing costs to shore up the fund or a diversion of CARES act funding that is occurring in other states. 

Note also that these are projections, which can change as new data becomes available and may differ from actual collections.  

Originally created and posted on the Oregon Housing Blog


Monday, November 30, 2020

Oregon's Unemployment Insurance Trust Fund Balance Decline Over 4 Years Is Projected at 85%/$4.3 Billion.

I obtained the 2021-2023 Oregon Employment Department agency request budget (It's a large (60MB) file) through a public record request, and it's posted HERE). 

The request projects a significant decline in the unemployment insurance trust fund balance over a four year period. [See page 43 of 965 for trust fund balance projections].

The graph and table shows a decline from $5.073 Billion as of March 31, 2020 to a projected balance of $738 million as of March 31, 2024. That's a decline of $4.3 Billion/85% in 4 years, an average decline of $1 Billion+ per year. NOTE: Projections could change by the time of Governor's Budget request submission in January 2021).

The trust fund balance has now slipped below $4 Billion for the first time since the first quarter of 2018, and was at $3.847 Billion as of November 27th.

In subsequent posts I will look at unemployment taxes, rates and collections.

Courtesy, Oregon Housing Blog.  


Friday, July 31, 2020

Wednesday, July 29, 2020

Oregon Unemployment Insurance Made A Net of $661 Million Available for Housing Expenses, $951 Per Month. Loss of Supplement Would Mean 64% Cut.

Earlier I had posted county level details on the amount of unemployment insurance benefits paid in Oregon counties from Jan to June 2020.

I have now added two tables to the former PDF file and have posted this 5 page PDF HERE, and embedded below. 

The two tables I added show 

  • On a MONTHLY basis the average NET UI available for housing expenses ($951 averaged over 6 months).
  • The total NET UI amount available for housing expenses. ($661 million total over 6 months)

Both tables use these assumptions/calculations:

  • 16% of UI was paid in state and federal income taxes
  • 30% of that net amount was available for housing expense
  • Simplified, 25.2% of the gross amount of UI was available for housing expenses. 

Loss of $600 Supplement Cuts Amount Available for Housing Expenses by 64%, Leaving Average of Only $351 Monthly.
As with the earlier post, the amounts shown DO include the $600 supplement, which has now expired. After taxes, that $600 weekly supplement provided, for housing expenses: 
$151 weekly
$655 MONTHLY 
$7,862 annually

This means that 64% of the average net MONTHLY UI available for housing expenses over the 6 month period ($655/$951=64%) came from the supplement. 

Without the $600 supplement the average NET UI remaining for housing expenses is only $331 ($951-$600=$351).

Originally created and posted on the Oregon Housing Blog

Monday, July 27, 2020

County Rankings by Record Setting June Oregon Unemployment Benefits Paid.

It's taken a minute but OED is improving their reporting of unemployment data; I very much appreciate the improvement.  

I discovered the first updated county level table (with June data) I have seen in a while this morning HERE.  It shows the county distribution of $1+Billion in unemployment benefits paid and 1+Million payments made in June. 

I converted the OED PDF into Excel and sorted it by county based on the # benefits paid and then created a new PDF file posted HERE and embedded below. 

I added columns that show the county share of UI benefits and UI payments and also added a column that shows the average payment made. Note that this amount DOES include the $600 bonus payment, which has now expired. I also highlighted those counties where the UI average payment was higher than the $905 June state average.  

Originally created and posted on the Oregon Housing Blog.

Record Setting June: OED Awards $1 Billion in Unemployment Insurance Benefits and Makes 1 Million+ Payments.

The much criticized Oregon Department Employment Department in June set new unemployment insurance records that were staggering in scale. 

OEC sent to Oregonians more than $1 Billion in benefits and made nearly 1.12 million payments. 
 
In one month, that's more than 2 and 1/4 times the $430 million TOTAL Oregon UI amount paid in ALL of CY 2019 and 100,000+ more payments than were made in CY 2019 (1.07M).
  
So, every day in June, OED sent out an average of $33+ million in UI benefits and made an average of 37,000+ payments.

The PDF HERE and embedded below has two graphs showing details by month for 2020, through June:

1. The number of benefit payments made and the dollar amount of those benefits. 
2. The average payment (dividing total number of payments made). 

Note that:
Payments and benefits shown include ALL Unemployment Insurance programs (Regular, PUA, Workshare, FPEUC, EB, and FPUC [the $600 supplement]). Programs other than Regular Insurance were important as DOL data shows in June that Regular Insurance payments were only $313 million of the $1 billion total reported by OED.

In April the $600 FPUC UI supplement kicked in. 
In the PDF second page/graph the average payment (analogous to the weekly benefit average) was $406 in March but increased to $905 in June

Loss of $600 Supplement Will Cut UI by 60%+, Starting NOW.
Unfortunately, with the $600 [FPUC] supplement not yet renewed that means starting July 26 weekly checks will be reduced by more than 60%, likely averaging near or below the average Oregon WBA for ONLY Regular Unemployment insurance level-- $362 in June.

The June OED report with payment data used for this post is HERE.

Originally created and posted on the Oregon Housing Blog.

Tuesday, July 21, 2020

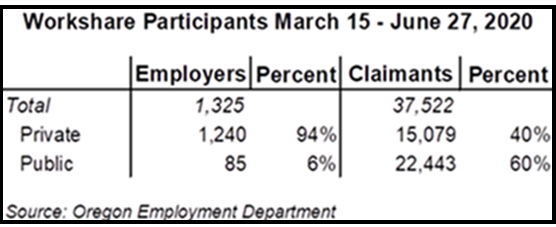
Oregon Workshare: 60% of Workshare UI Claims Were From Public Employees.

I’m pleased to report that the Oregon Employment Department has responded to my public record request with a snapshot of private and public employees who are participating in Workshare.
 

March 15-June 27
From March 15-June 27 the OED breakout shows that 60% (22,443 ) of the total 37,522 Workshare claims were public employee claims. The average number of claimants per public agency was 264, while the average number of claimants per private employer was much lower at 12. 

My Updated Projections Through July 11
DOL records show that Oregon Workshare continuing claims have increased from 28,498 from the week ending June 27 to 51,173 as of July 11.  

So, if the OED reported 60% public employee percentage distribution as of June 27 held, the data in the latest DOL report would mean that the total number of public agency employee Workshare continuing claims is now 30,704. Given the recent large spike in claims if the public agency share during the spike was greater than 60%, than the total public agency percentage and counts would be higher than 60% and 30,704.

Because the total number of Oregon state and local employees is close to 250,000, a total of 30,000 public agency Workshare continuing claims would represent about 12% of total Oregon state and local government employment, which is close to the overall Oregon insured unemployment rate. 

NOTE:
If the $600 UI supplement expires on July 25 as scheduled, or if it is not renewed at some level, there could be a rapid and significant drop off in all continuing claims, including Workshare claims at public agencies. 

Conversely, as I pointed out in my recent post, IF the UI supplement and supplement expiration date are extended and IF the Workshare Dec 31st expiration date is also extended, this could provide an important tool to help Oregon state and local governments reduce their wage expenses in a challenging budget environment (as Workshare is 100% federally funded).


Originally created and posted on the Oregon Housing Blog.