
Last January I created an Excel workbook with 2020 HUD subsidized housing data for Oregon using the HUD Picture of Subsidized Housing database; the blog post with that workbook is HERE.
HUD has now posted updated 2021 data HERE and I created a new 2021 Excel workbook HERE with Oregon data.
The data is available at multiple geographic levels including project, census tract, zip code, city, county, CBSA, Congressional District, and state levels, with the NEW Oregon congressional district added for the first time.
The 2021 workbook opens to an index to help navigate to specific worksheets. (This requires a macro enabled workbook, IF that doesn't work for you I have posted a a macro free workbook is HERE; its possible that the index will not work as well).
The HUD data dictionary for 2021 is HERE. The Picture data from HUD is the most comprehensive that I have found and I encourage readers to look at the data dictionary to see the wide range of information available.
I set filters in the worksheets to make it easier to zero in on data of interest; in addition I added Pivot tables to the all states and project level worksheets.
Note that both workbooks for 2020 and 2021 are quite large, in excess of 200 MB.
2021 Notes, with updates from last years blog post.
The counts for 2018 were 52,887 units and 97,094 people,
The 2020 HUD Picture data counts were 54,820 HUD assisted units in Oregon with 97,094 people.
The 2021 HUD Picture data counts were 55,982 HUD assisted units in Oregon with 96,709 people.
So since 2018 there were 2,995 units added but the count of people declined by 485. The decline in people could be the result of different reporting rates, or more assistance going to one person households.
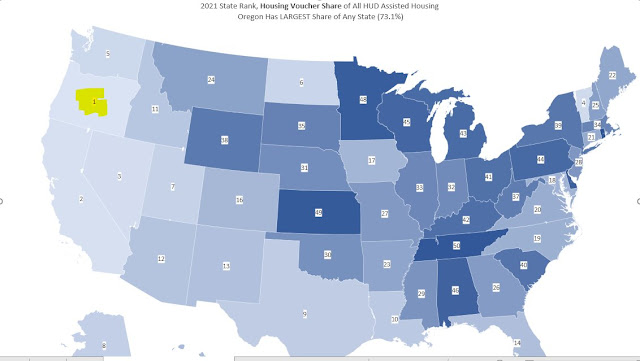
Oregon Continues to Have the Highest Share of HUD Assisted Housing Units Delivered Via Voucher Program.
The map pasted below shows that Oregon ranks #1 again in the share of HUD assisted units delivered by the voucher program. 73.1% of all Oregon HUD assisted units come from the voucher program vs 52.4% nationally.
The Share of HUD Assisted Housing Units In the Public Housing Program in Portland and Oregon is Very Small.
Another worksheet shows a comparison between the Portland Maine, Metro area and the Portland Oregon Metro area. It shows that Oregon's Portland Metro area has 171% more total HUD assisted units, BUT 8% fewer public housing units. This carries forward to Oregon which has the 7th lowest share of HUD assisted units delivered through the public housing program.
Women, Minorities, HUD Spending and Tenant Rents.
In Oregon 55% of all HUD assisted units were reported as headed by women, 19% by women with children, and 27% by minorities.
The default view of the Pivot table of project data shows by city and by project name the percentage of units occupied by minorities and headed by women, as well as the HUD spending and tenant paid rent..
So for example in Lake Oswego there were two HUD assisted projects with one having 7% minority residents and the other with 10% minority residents. In those projects 83% and 73% of unit were headed by women. HUD spending is reported at $172 per month in one project but $1,111 per month in another. Tenant rent is much closer, reported as $379 per month in one project and $347 in the other.
In the city of Portland minority head of household percentages in HUD assisted projects ranged from 7% to 96%. The range of units headed by women ranged from 1% to 88%.
Excluding public housing projects reported HUD spending is as high as $1,632 per month, with a low of $223. (I excluded public housing because the reported spending includes both operating subsidy and capital improvements, so if there are capital improvements to a project that would distort per unit spending .
Tenant rents in Portland ranged from $160 to $598 per unit per month.
Originally created and posted on the Oregon Housing Blog.


No comments:
Post a Comment